
How Growing Your Website Traffic Can Drive In-Store Foot Traffic
September 22, 2017
Online Reviews and the New Buyer’s Journey
November 19, 2017Data visualization matters – a lot.
By some estimates, 65% of people are visual learners and process information best by seeing it. To a certain degree, however, we may all be visual learners when it comes to complex data because a well-designed visual can condense lots of numbers into a more readily apparent outcome or trend. Not surprisingly, when it comes to business, data visualization is a critical tool. Timely, transparent analytics in graphic, bite-sized formats can help managers understand their companies better, identify potential customers, and hone in on effective growth strategies.
If you’re a digital marketer, chances are you work with data all the time. But, in reality, your clients may not. Even with mounds of fascinating metrics available in their marketing reports, managers often come back to us and ask, “OK…now what?” The problem is compounded by the fact that marketing data is everywhere – different platforms, different formats, different reporting options, different reference points.
In April of this year, I wrote about Google Data Studio, a tool that pulls data from the Google ecosystem and can be used to populate configurable, visual dashboards. It’s become an absolute mainstay in our client reporting toolkit allowing us to give performance snapshots across a broad range of digital marketing metrics. However, beyond the data you can mine from Google, there are many other important performance metrics to consider – social media ad engagement, email campaign click-through rates, video views – to name a few. Now, with Data Studio Connectors, you can pull all types of data into your Data Studio (DS) dashboard from platforms that are outside Google.

I decided to take Data Studio Connectors for a spin. These Connectors were launched by Supermetrics on September 7, 2017. Now there is no need to first pull all the marketing data into Google Sheets and then into Google Data Studio – you can use the Connectors to pull the data directly. I set myself a challenge – I wanted to layer some social media metrics onto a client report we had already created in Data Studio that included Google Analytics and Google AdWords data.
It worked! My new, improved dashboard report consolidated, streamlined, and visually standardized social media metrics into our current Data Studio report.
Here’s a step by step:
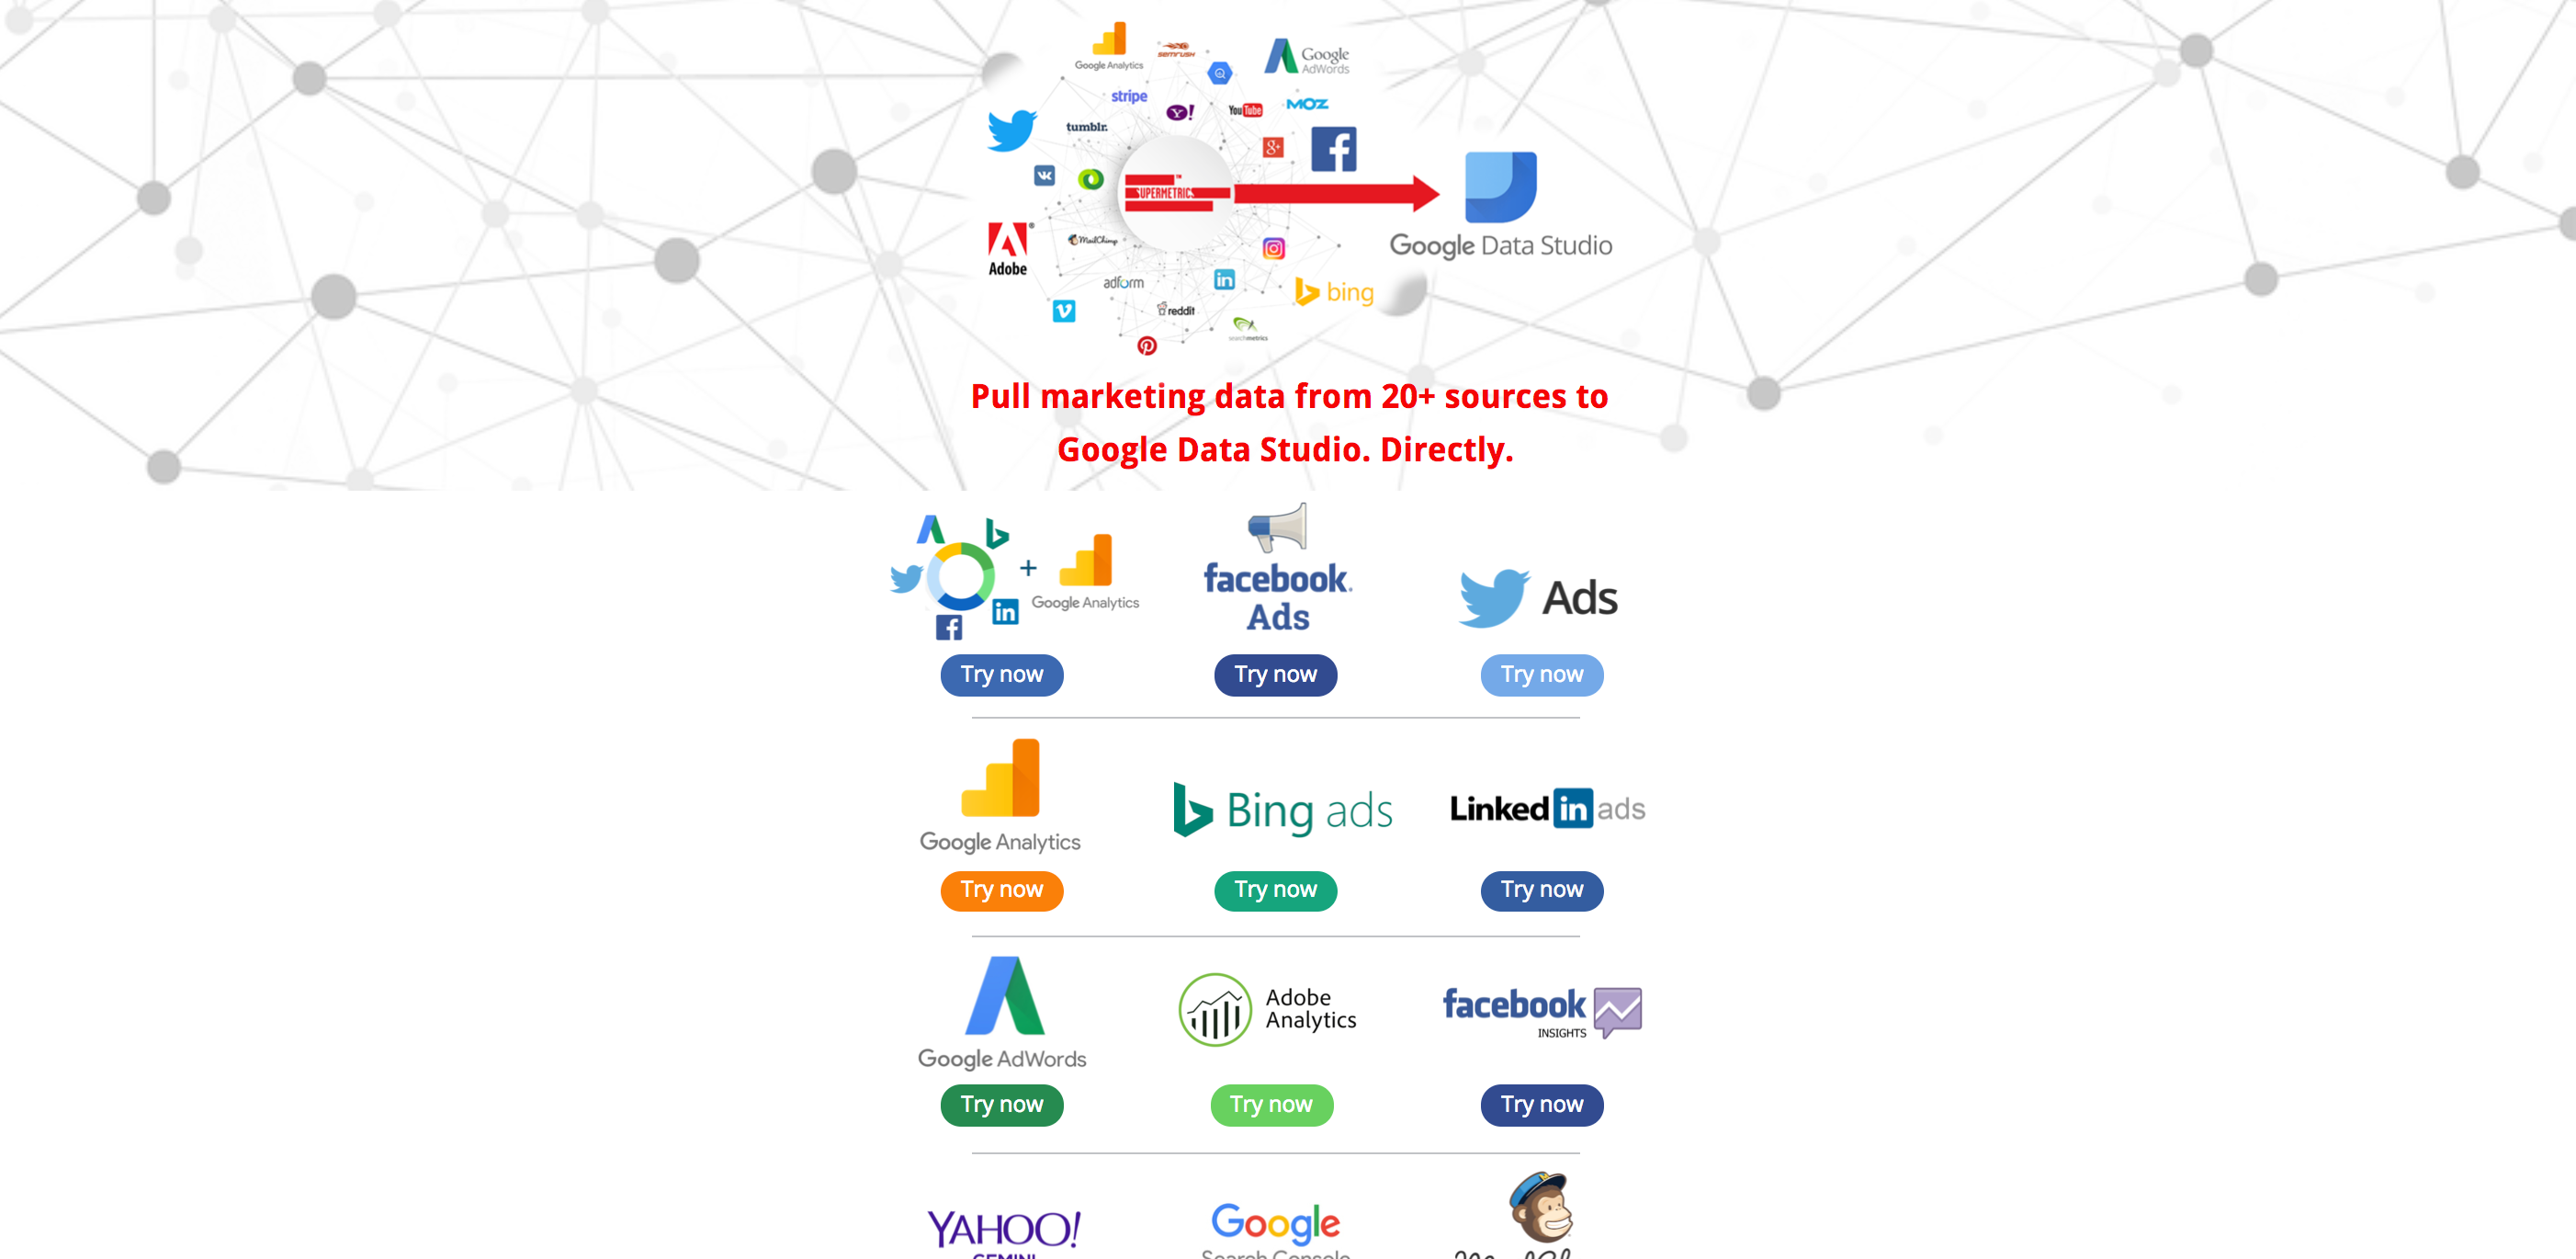
Step 1: Pick a Data Studio Connector
Go to the Data Studio Connectors homepage, scroll through the available Connectors and choose which one you would like. I picked Facebook Insights and clicked the Try now button. On the next screen in the top left where it says Untitled Data Source, I named my Connector data source (Agency Tip: Put your client name in there too, so you know which client) and then click Authorize.
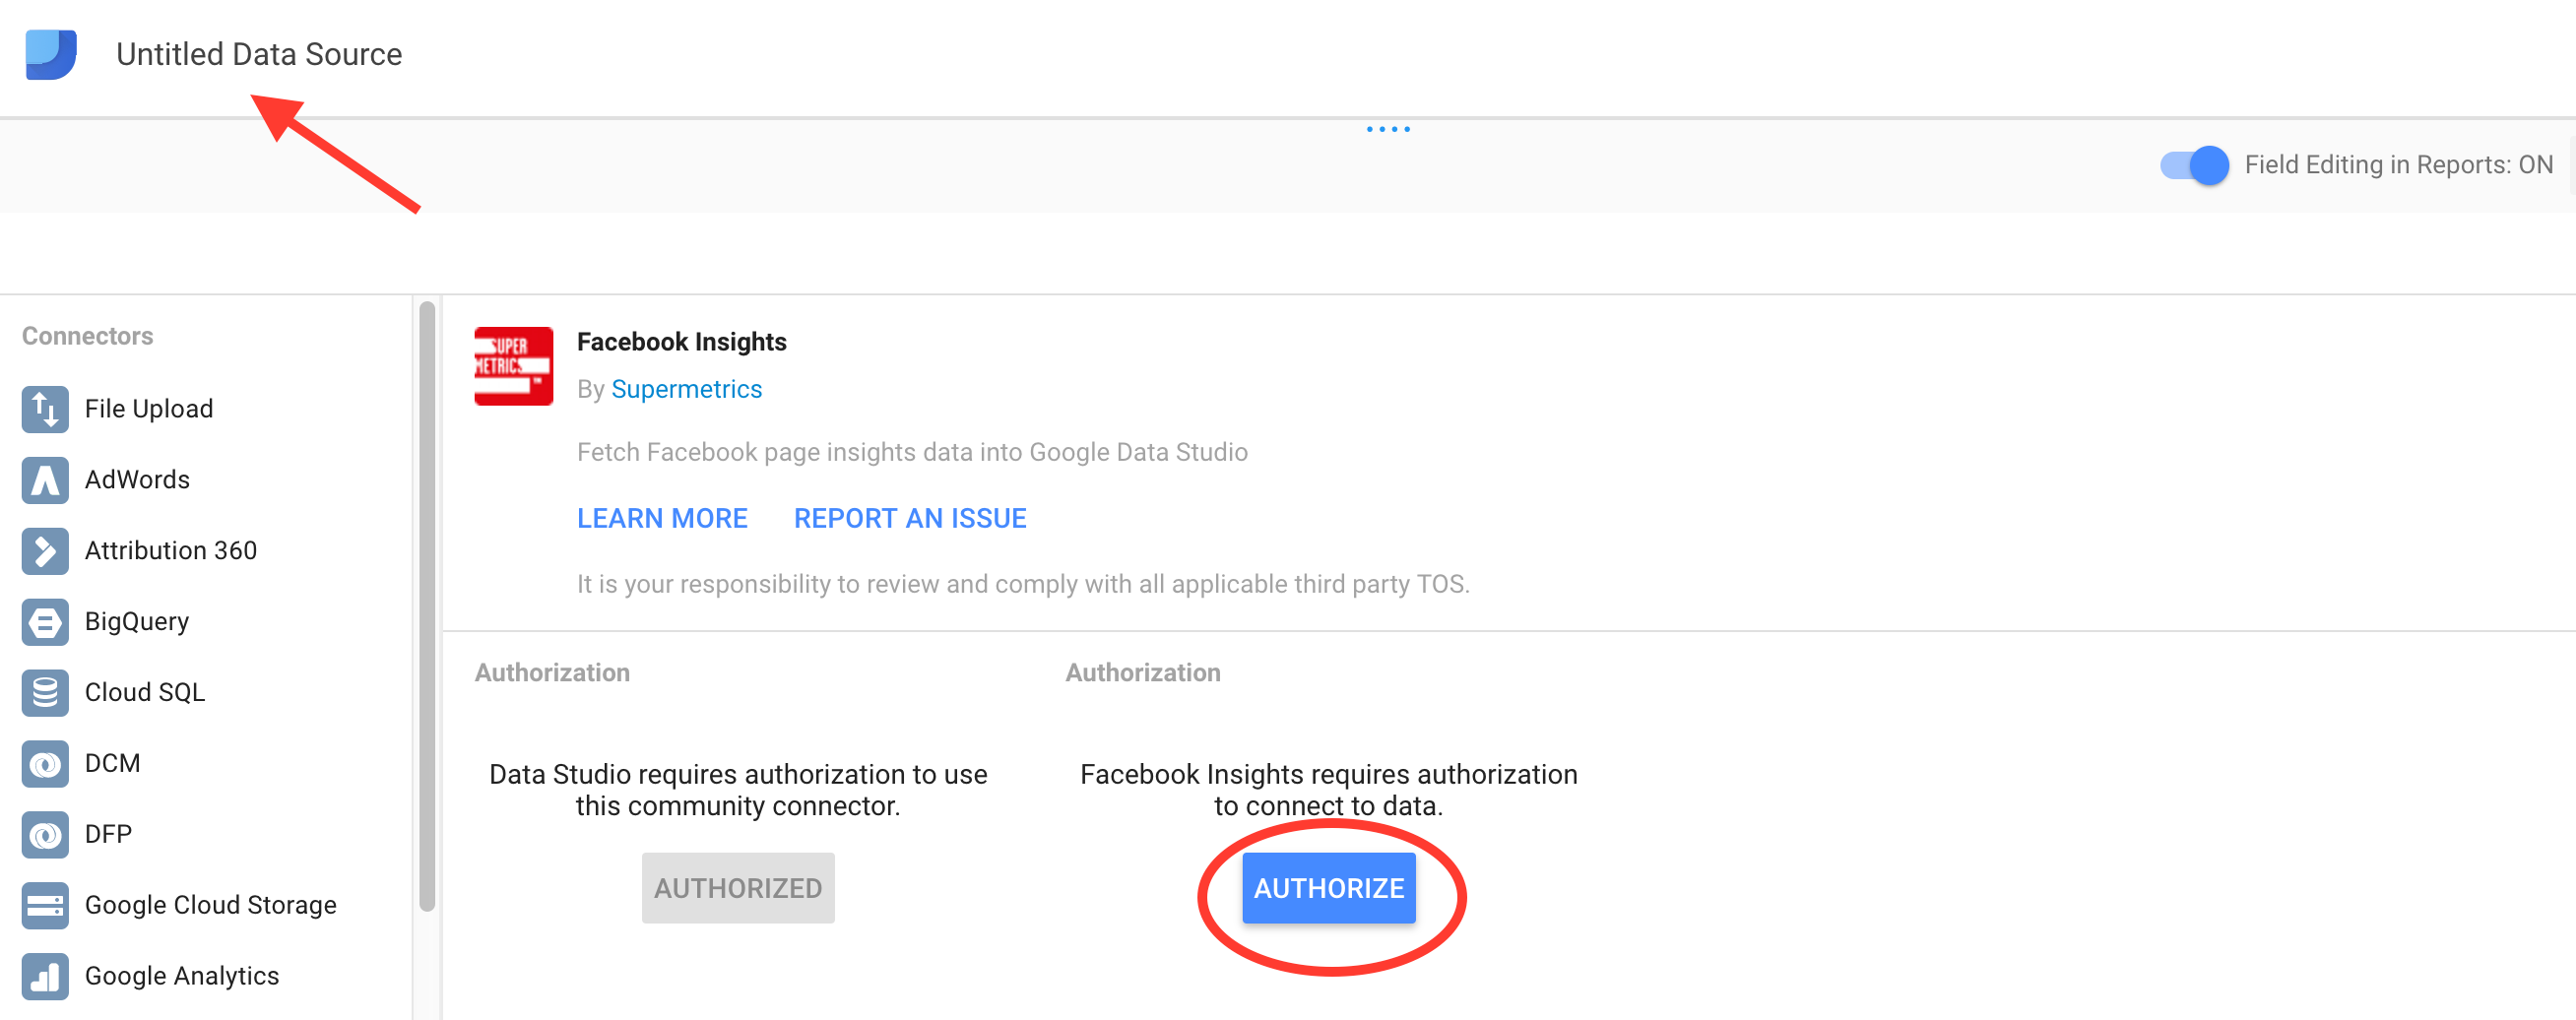
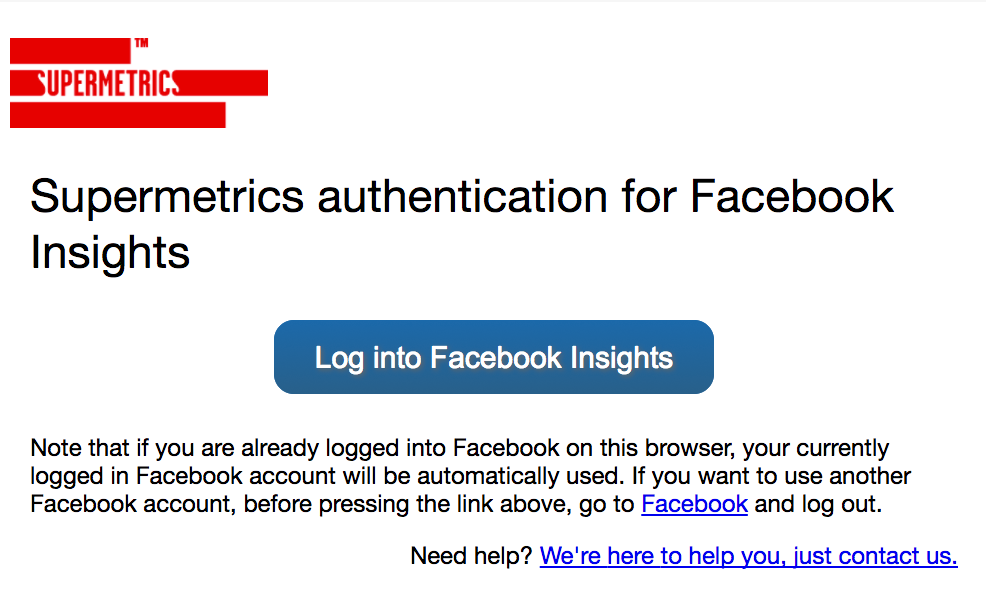
Step 2: Connect your outside data source
I was prompted to choose a Google account, and I did. Once the Community Connector was authorized, I then had to Authorize Facebook Insights, my chosen Connector. I followed a prompt allowing Supermetrics to authenticate and connect to my Facebook Insights, and to be on the safe side, I decided to ensure I was both logged into my Facebook account and had the correct client Facebook business page opened in a tab too.
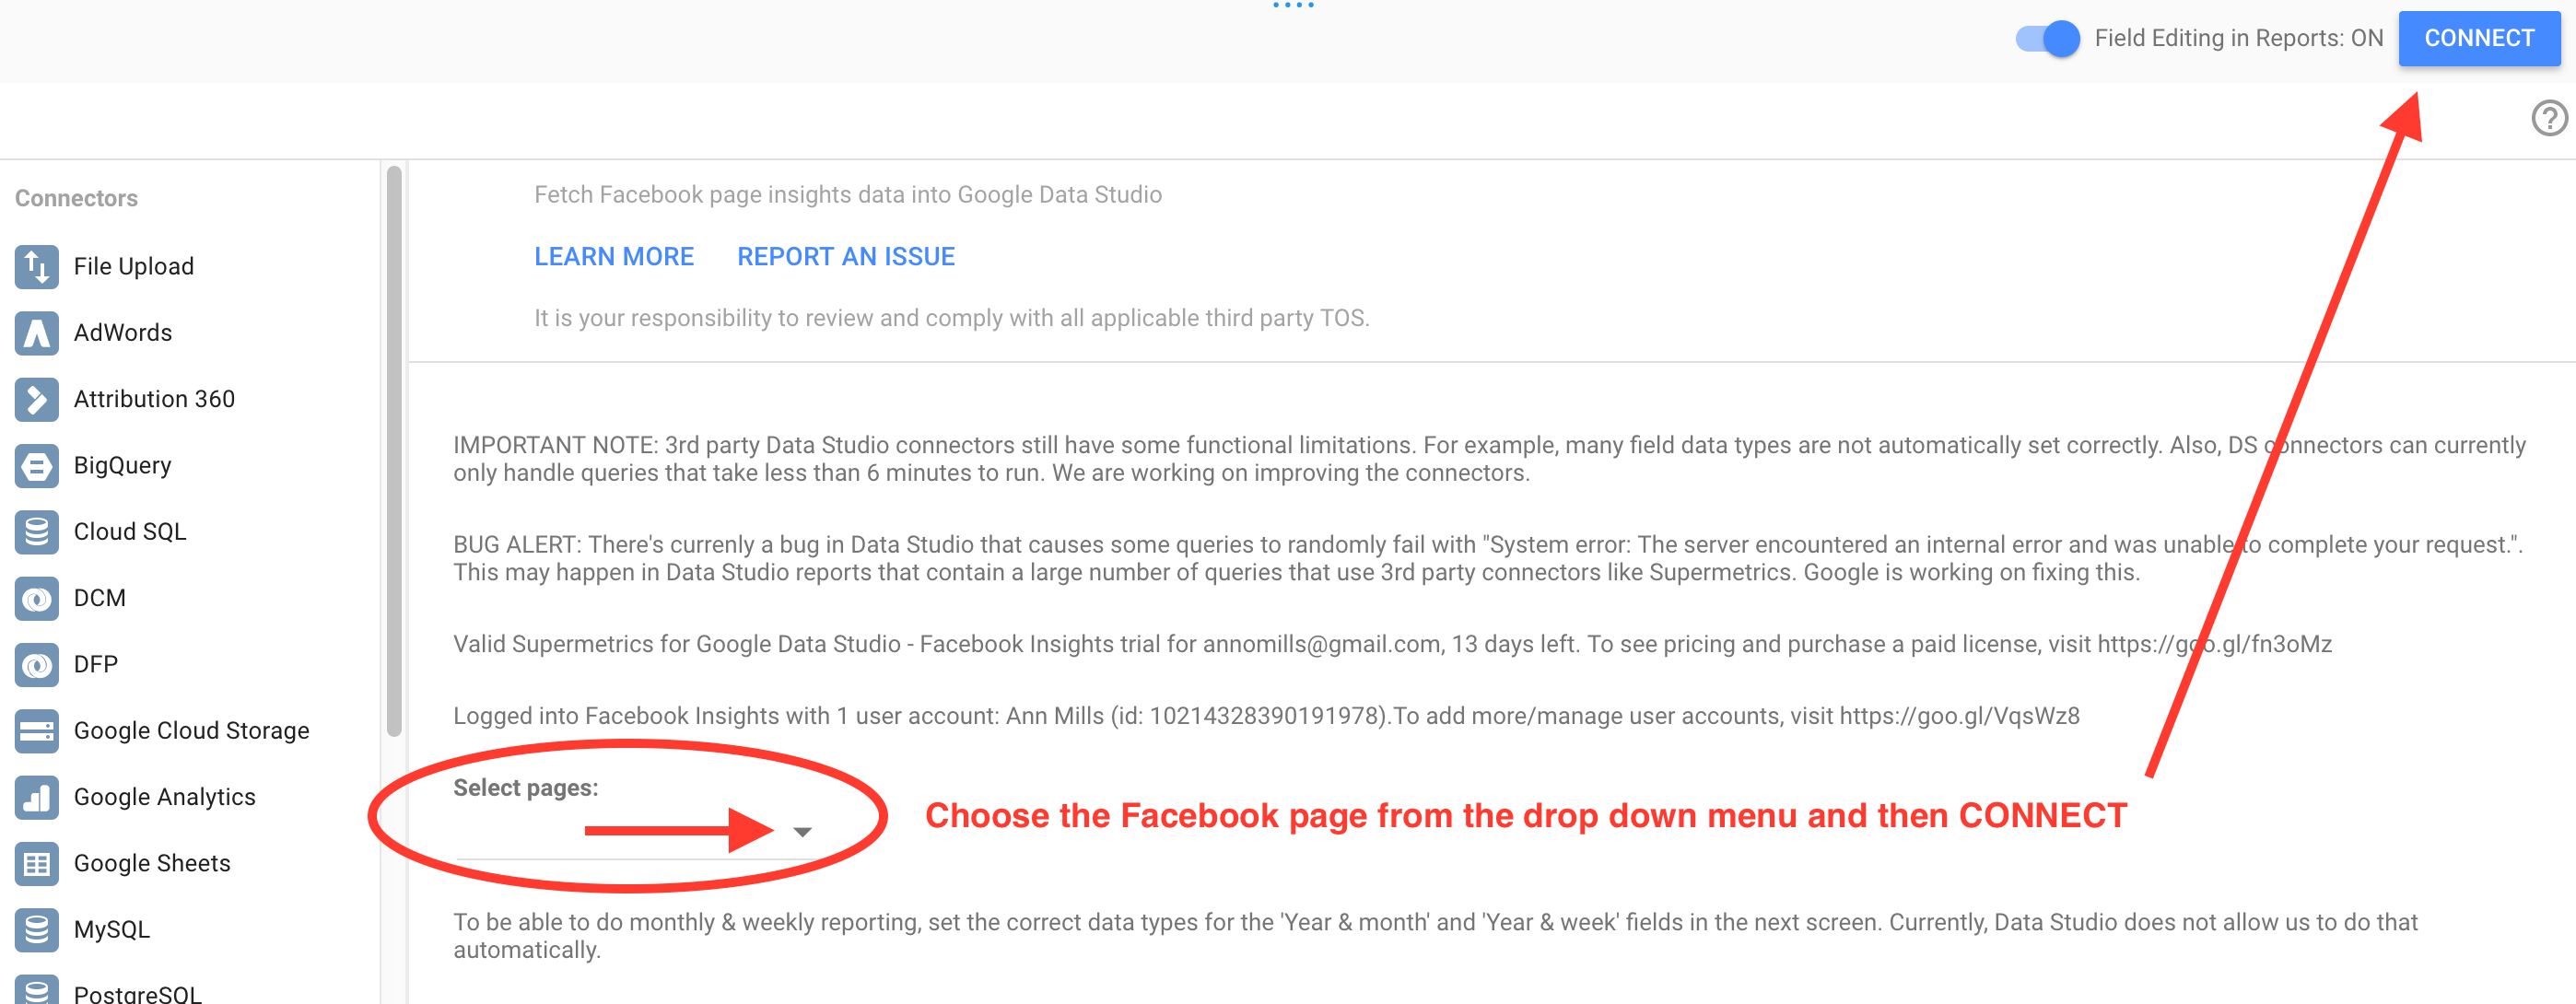
Step 3: Choose the correct Facebook page
This step is mission critical if you’re a digital marketer as you’ll no doubt manage and be an admin to many client Facebook pages. You are given the option to see all the pages you manage and then you choose the page you want. Once you choose the Facebook page from the drop-down list and CONNECT, the Data Connector will pull data specific to that page.
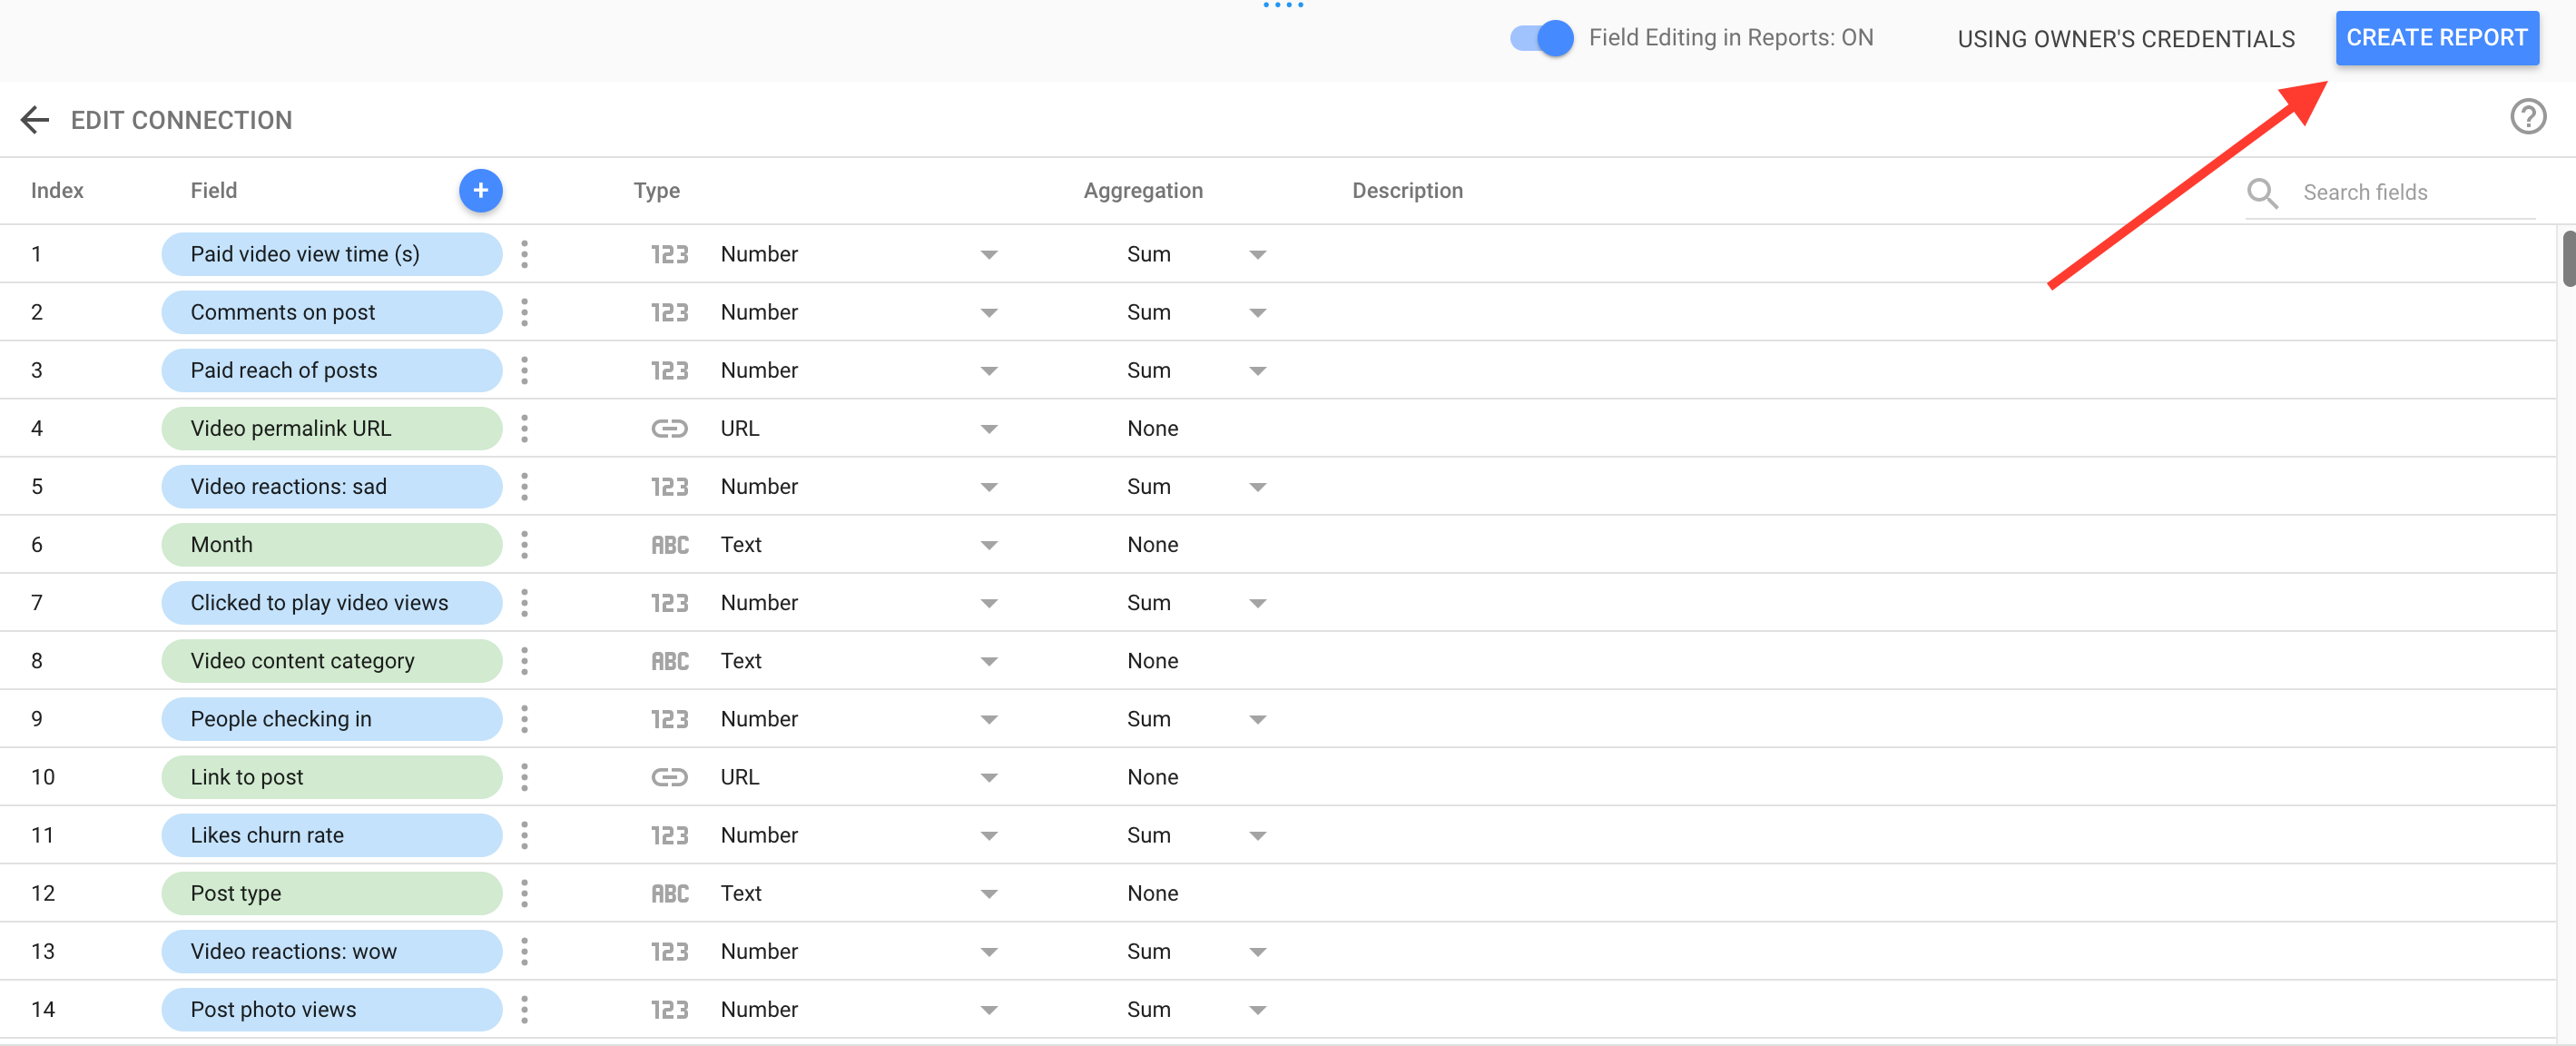
On the next page which shows all of your data sources, you can edit them (I didn’t) and CREATE REPORT. You’ll notice the portal looks pretty familiar now as you are in Data Studio.
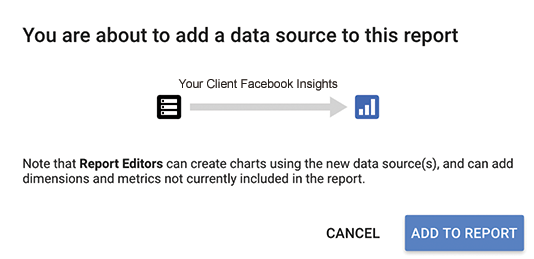
ADD TO REPORT the data source that is being pulled into your Data Studio portal via the Connector.
Supermetrics Data Source for Clients
Step 4: Build Out Your Google Data Studio Report
In the final report building stage, there’s good news, bad news and then some more good news.
The first bit of good news is that all of your data is now being pulled in by the chosen DS Connector and is accessible in a list of metrics. The bad news is that there are a lot of metrics – I counted 123 in total for the Facebook Insights Connector.
If you don’t correctly align the:
- Data Source
- Dimension
- Metric
you will not get meaningful metrics in the dashboard. When you have to choose from People Clicking Your Content, Content Clicks, Post Unique Link Clicks, or Post Other Clicks, it can be a challenge. I toggled back and forth to the Facebook portal to confirm I was choosing the exact metric I wanted and built out the report. If you’ve never built a Data Studio report, read about how to build one in our blog, Google Data Studio: 3 Easy Steps to Your Website Analytics.
The additional piece of good news is Supermetrics is in the process of developing a Facebook Insights Template for Data Studio. The metrics will be pre-selected and split by correct dimension thereby simplifying a currently complex process.
All in all, I thought the Supermetrics DS Connector I used to build Facebook Insights data into our Google Data Studio report was excellent. Prompts guide you through the authorization process and once the outside data source of choice is connected, you can utilize the powerful drag and drop report building functionality and customization capability of Data Studio. And although it’s fun to build reports, in the end, it comes down to data visualization.
If, as marketers, we can present data-driven insights to our clients in a holistic, transparent way, they will run better, more profitable businesses.


